Finding market segments of young people based on their music and movie preferences.
Movie Clusters
PC1
PC2
PC3
Music Clusters
PC1
PC2
PC3
Compare cluster solutions

Movies- Hierarchical Clustering

Movies- K-Means Clustering

Music- Hierarchical Clustering

Music- K-Means Clustering
Movies
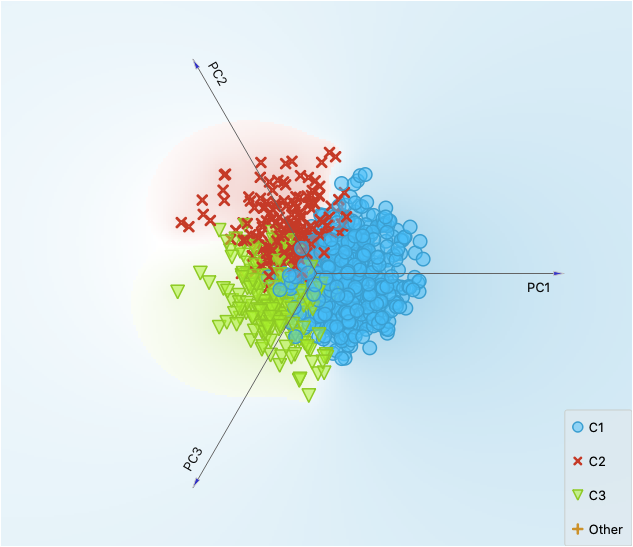
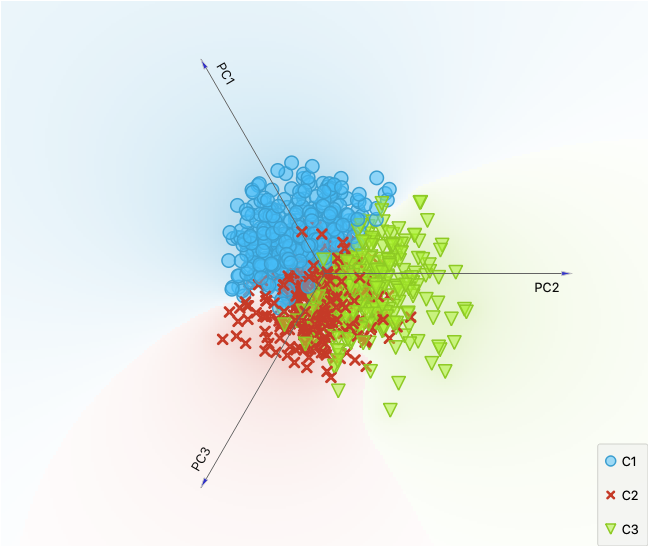
K-means and Hierarchical cluster results were not similar with different cluster groups being represented on different axis’ PC2&3 overlap due to its similar variables seen in the clustering groups. K-means seems to have done a better job than Hierarchical.
Music
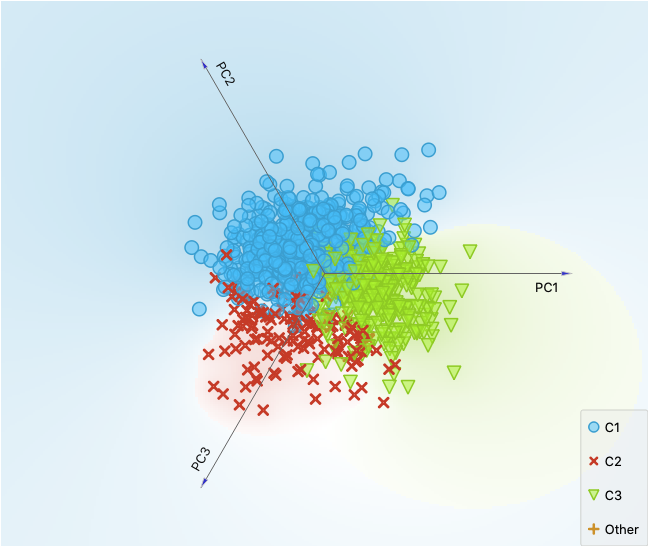
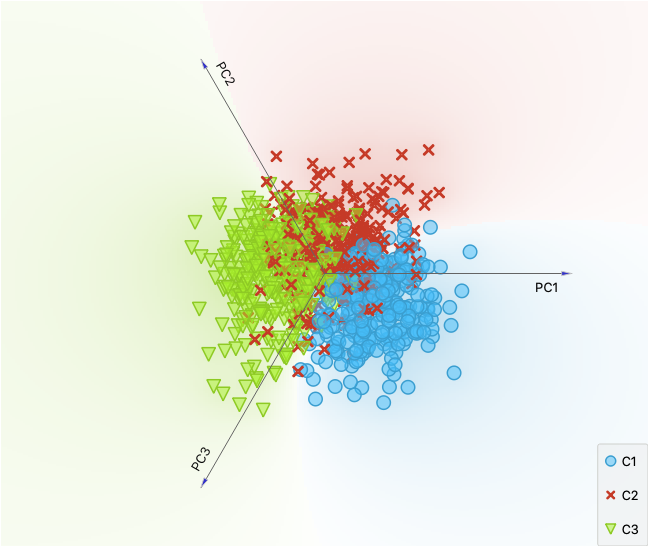
K-means and Hierarchical cluster results are slightly similar even though the clusters are not coloured the same, the overall area they are in are similar in both graphs.
Compare clusters on their music, movie preferences and on demographics.
Movies
Because of the clusters taking the positive correlations, we can see that in both clustering algorithms:
A majority of females in both flats and houses are likely to watch romantic movies then males.
More females in flats are more likely to watch fantasy and animated movies than females in houses.
Males are more likely to watch documentary and war movies flats than in houses.
Music
Because of the clusters taking the positive correlations, we can see that in both clustering algorithms:
Females in flats are more likely to listen to Latino, dance, pop and musical than females in houses/bungalows according to the PCA2.
There doesn’t seem to be much difference between genders and living conditions on cluster 3 for both algorithms.


